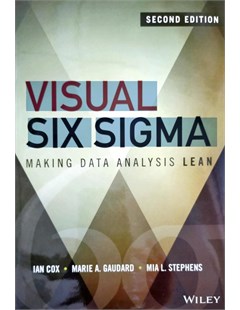
Visual Six Sigma Making Data analysis lean
Because of its unique visual emphasis, Visual Six Sigma opens the doors for you to take an active role in data-driven decision making, empowering you to leverage your contextual knowledge to pose relevant questions and make sound decisions.
2016.
This book shows you how to leverage dynamic visualization and exploratory data analysis techniques to:
- See the sources of variation in your data
- Search for clues in your data to construct hypotheses about underlying behavior
- Identify key drivers and models
- Shape and build your own real-world Six Sigma experience
Whether you work involves a Six Sigma improvement project, a design project, a data-mining inquiry, or a scientific study, this practical breakthrough guide equips you with the strategies, process, and road map to put Visual Six Sigma to work for your company.
Broaden and deepen your implementation of Visual Six Sigma with the intuitive and easy-to-use tools found in Visual Six Sigma: Making Data Analysis Lean.
Ian Cox, Visual Six Sigma Making Data analysis lean, John Wiley &Sons,Inc, 2016.
 |  |  |
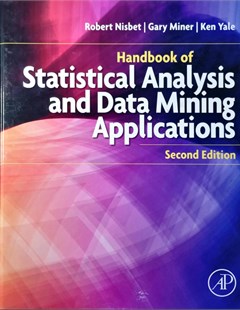
| Visual Six Sigma Making Data analysis lean | Handbook of Statistical analysis and Data mining applications | Data Modeling Essentials |
Thứ Sáu, 14:32 17/03/2023
Copyright © 2018 Hanoi University of Industry.