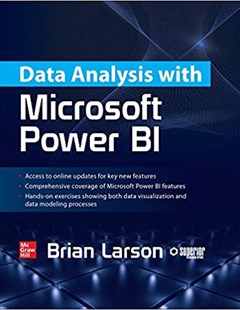
Data Analysis with Microsoft Power BI
Explore, create, and manage highly interactive data visualizations using Microsoft Power BI. Written by a recognized BI expert and bestselling author, Data Analysis with Microsoft Power BI teaches you the skills you need to interact with, author, and maintain robust visualizations and custom data models. Hands-on exercises based on real-life business scenarios clearly demonstrate each technique.
2020
Explore, create, and manage highly interactive data visualizations using Microsoft Power BI
Extract meaningful business insights from your disparate enterprise data using the detailed information contained in this practical guide. Written by a recognized BI expert and bestselling author, Data Analysis with Microsoft Power BI teaches you the skills you need to interact with, author, and maintain robust visualizations and custom data models. Hands-on exercises based on real-life business scenarios clearly demonstrate each technique.
Contents:
•Understand Business Intelligence and self-service analytics
•Explore the tools and features of Microsoft Power BI
•Create and format effective data visualizations
•Incorporate advanced interactivity and custom graphics
•Build and populate accurate data models
•Transform data using the Power BI Query Editor
•Work with measures, calculated columns, and tabular models
•Write powerful DAX language scripts
•Share content on the PowerBI Service (PowerBI.com)
•Store your visualizations on the Power BI Report Server
Brian Larson, Data Analysis with Microsoft Power BI, McGrawHill, 2020
 |  |  |
Data Analysis with Microsoft Power BI | Service-oriented computing: Semantics, processes, agents | Data and Computer Communications |
Chủ Nhật, 15:20 26/02/2023
Copyright © 2018 Hanoi University of Industry.